Menu
State-of-the-art hospital operations: Data-driven decision making at all levels of management.
Share article:
Back to Reference page

Fakultní nemocnice Bulovka

State-of-the-art hospital operations: Data-driven decision making at all levels of management.

How to use data to shape the operation of the Na Bulovce hospital (3000 people, 3 billion turnover)? How to optimize the workload of people and departments, get costs under control and provide all levels of management with up-to-date information for day-to-day management.

A hospital with a tradition dating back to 1931, with more than 50 clinical departments, a turnover of CZK 3 billion and almost 3,000 employees is getting back in shape under the new management, thanks to the improved reporting and controlling process.

The disjointed database and information systems, which do not communicate with each other; the clinics and departments that manage their data solely independently; the internal service that must wait up to 14 days for the necessary data to create a data warehouse - those are the spheres where Bulovka is undergoing the major transformation. Within this transformation, the data warehouse will receive all the data - medical, warehouse, accounting, personnel etc. and will be able to prepare reports for doctors, hospital management and nurses, thanks to which they will be able to manage their work on the factual basis, understand what and how affects the profitability of healthcare, observe and control the drawdown of medicines and materials from the warehouse, etc.

"You can imagine our work as an air traffic simulator, where individual alarms show the number of patient visits, the consumption of medicines or the workload of each department of Bulovka. The system also includes various controlling mechanisms that automatically monitor and evaluate various risk areas and, if necessary, turn on warning lights. The hospital management gets an immediate overview of what is happening and where. This is happening in the form of real-time and easy-to-understand reports," says Mgr. Jan Kubů, Head of the Internal Audit and Controlling Department at Bulovka University Hospital.

Overall Situation

The hospital and its operations generate a lot of data and information about the treatment and patient care, consumption of medicines and supplies, and other operational matters. However, these data did not provide an overall picture of the hospital functioning. Disconnected data, various data formats, time or other unavailability of data, the absence of a data processing platform were some of the reasons why the hospital could not be effectively managed based on data.

Due to the lack of visualization tools, doctors and other staff were unable to work with data - relevant data was either not available or, the way the data was implemented into a working process did not allow doctors to make decisions based on it.

Change

Hospitals, comparable in size, turnover, number of employees and processes to large commercial organizations, are transforming into data-driven organizations. Three years ago, there was an Internal Audit and Controlling Department, which was responsible for managing and processing data from the entire hospital just for data management purposes. With this there started a change to ensure that data and information is available at the right time, in an understandable form and of a satisfying quality.

"The transformation to a data-driven hospital is not a project, but a process that we have started and will continue," says Mgr. Jan Kvaček, Director of Bulovka University Hospital.

The vision that drives the change

A doctor or a manager has relevant indicators across the entire hospital and access to the visualizations he or she needs to make the right decisions about the operation of the clinic or hospital. Data is linked into thematic units in the hospital, every change is immediately reflected - the management of the hospital can therefore make operational decisions according to the current situation.

The visualizations must be understandable at first glance, clear and allow going deeper into detail, where the doctor needs it.

Hospital management needs different levels of detail and parameters, and the visualization must be able to provide data interpretation at different levels of detail for different users.

"We are delighted to be on a project that has the ambition to change how the Czech healthcare sector uses data for care management and hospital operations. We are ready to continue to provide Bulovka with the support that it needs for successful implementation and adoption by staff," adds Tomáš Mátl, Managing Director of Colours of Data.

Solution

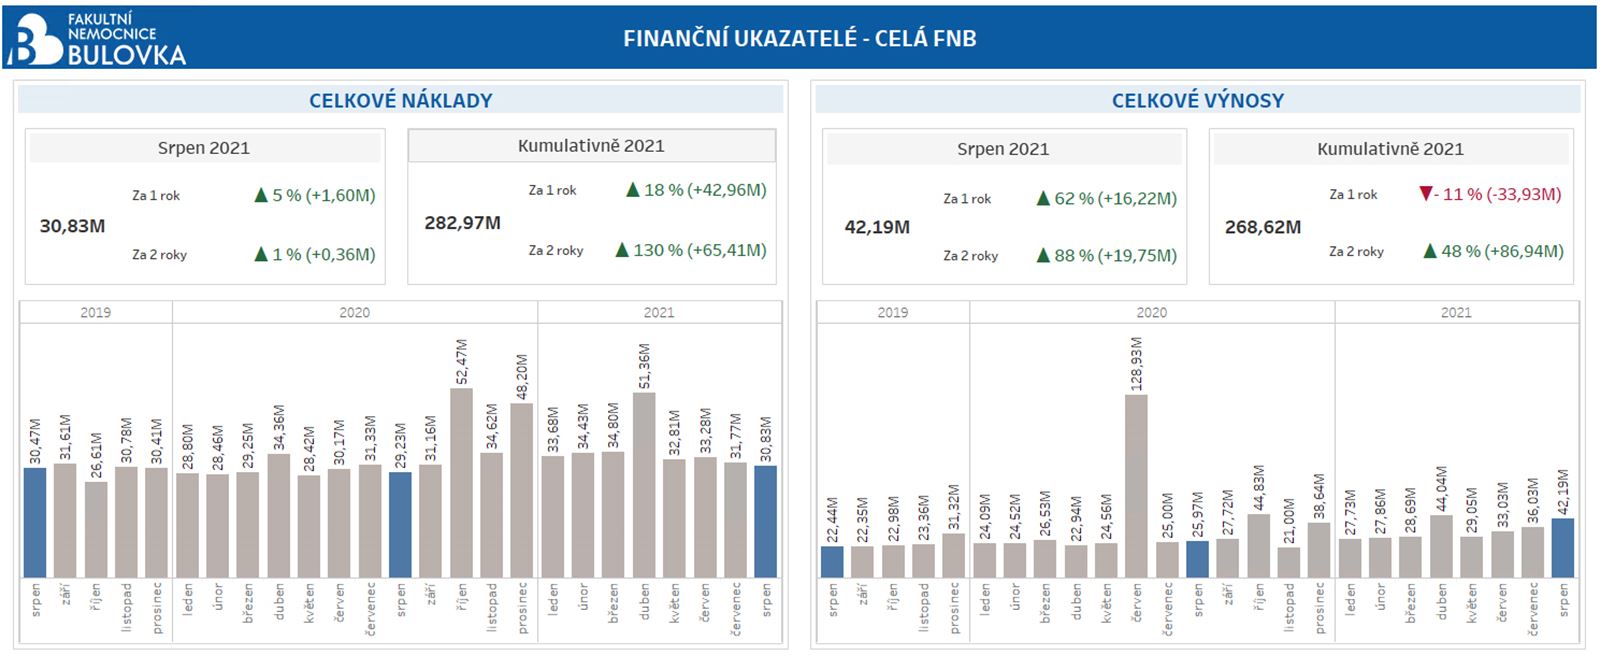
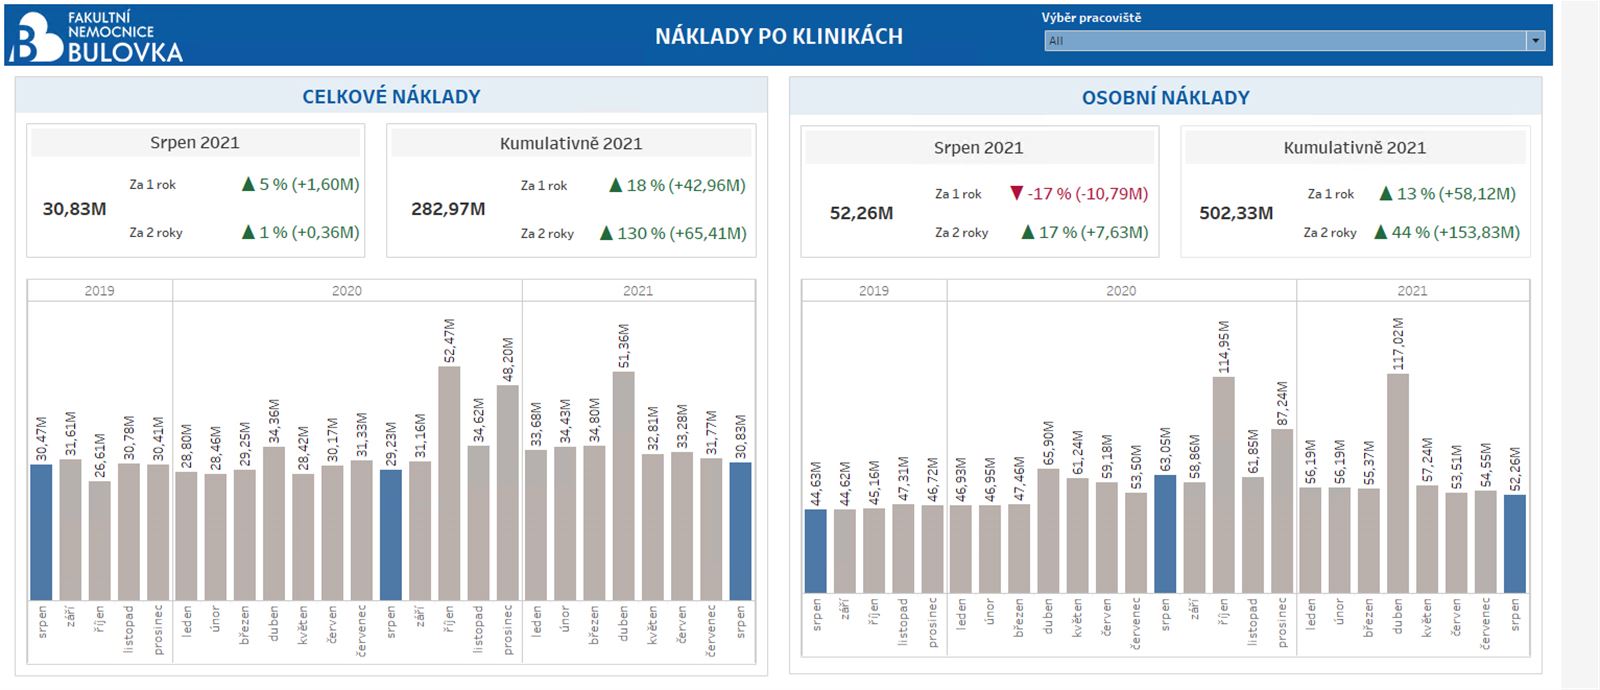
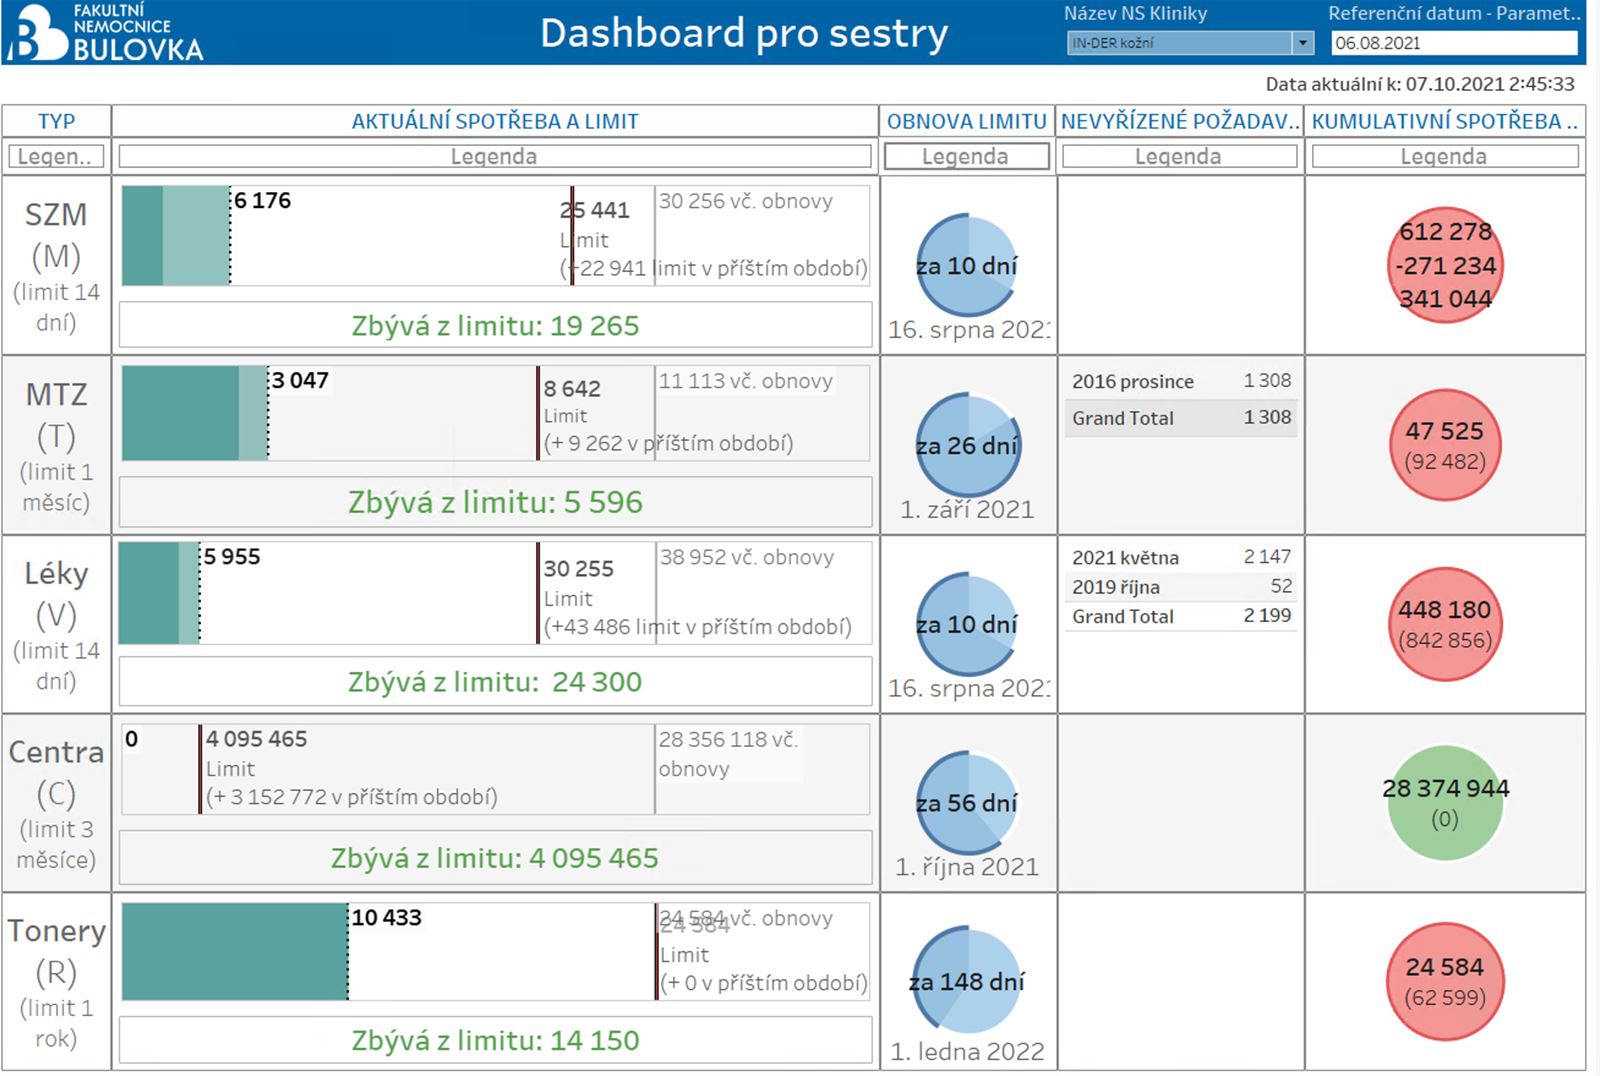
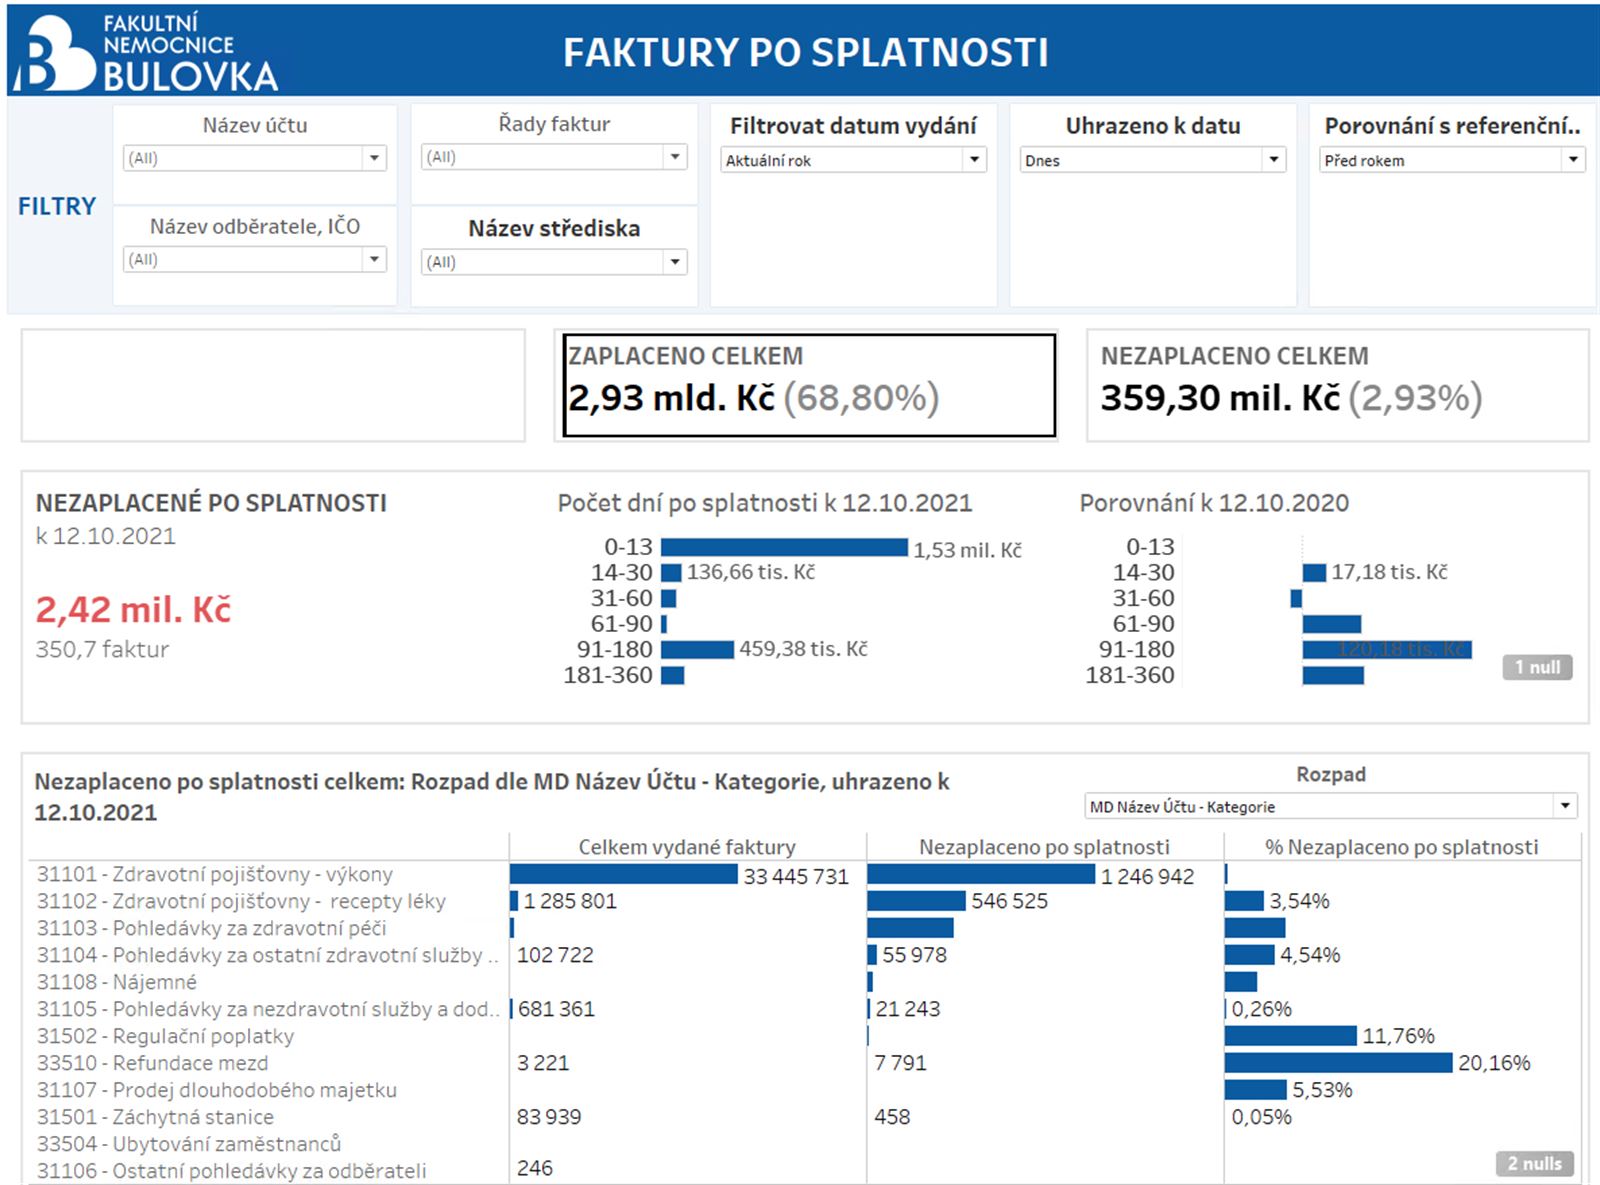
Dashboards were created to serve the doctors, and the hospital management. The visualizations have made care data accessible, provided an insight to the doctors and hospital management, and enabled better care planning, purchasing of medical supplies, and more efficient financing of the care provided.

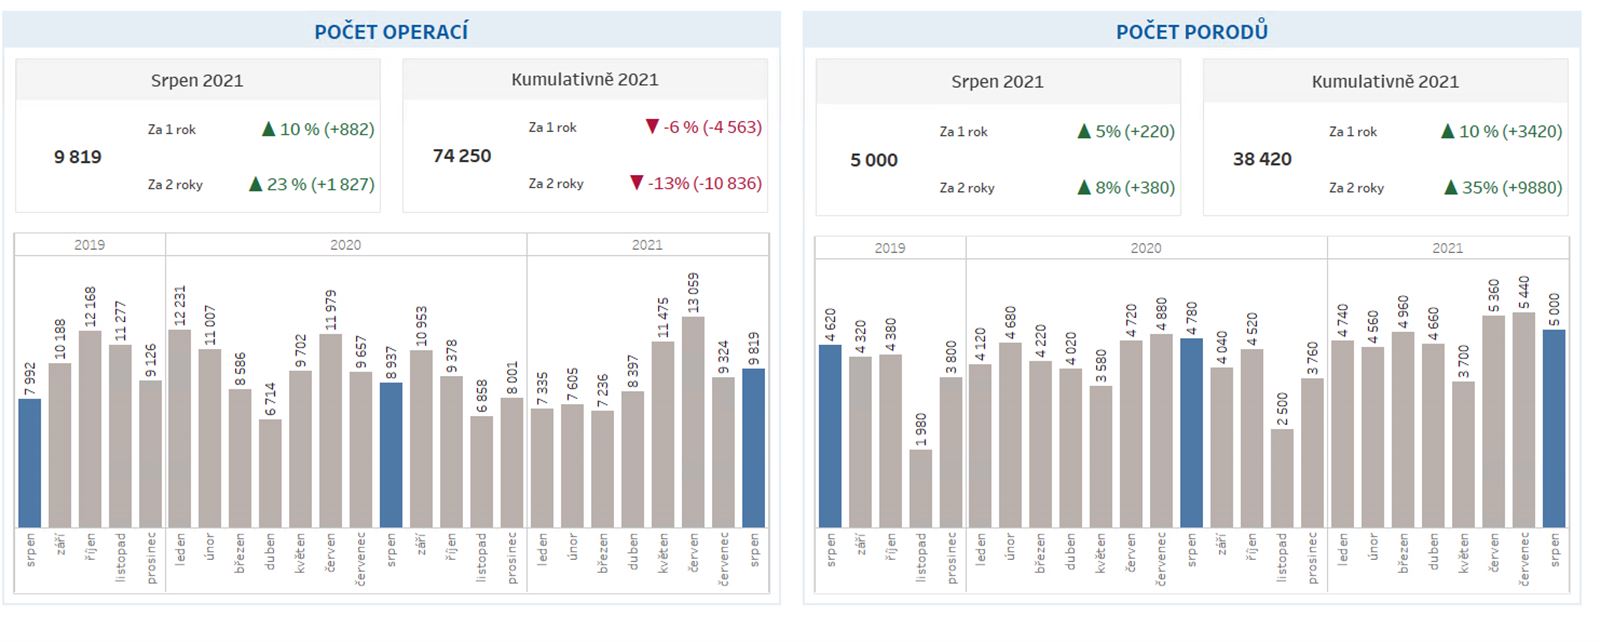
A practical outcome of this change could be, for example, a more convenient planning of the number of ambulances used each day, based on attendance. Another practical result would be a more appropriate preparation of the operating plan for the planned surgeries. Better clarity would allow hospital management to ensure better funding and investment in care.

The visualizations represent an outcome of a series of consultations, during which we were adjusting the settings for our client in order to make the view really intuitive and make the dashboards display what the doctors are most interested in, as well as maintain correct settings for individual users.

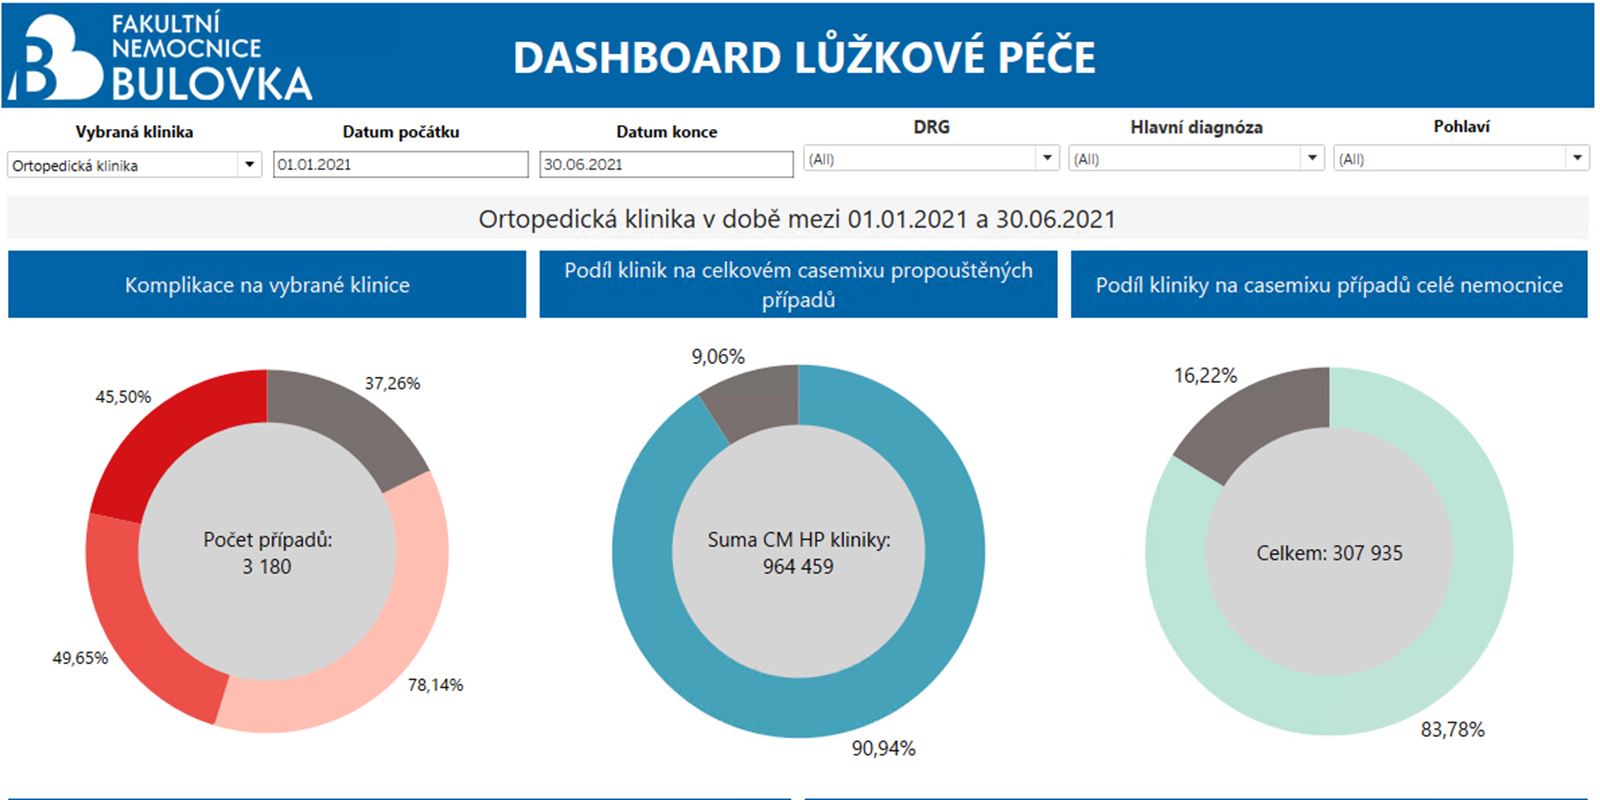
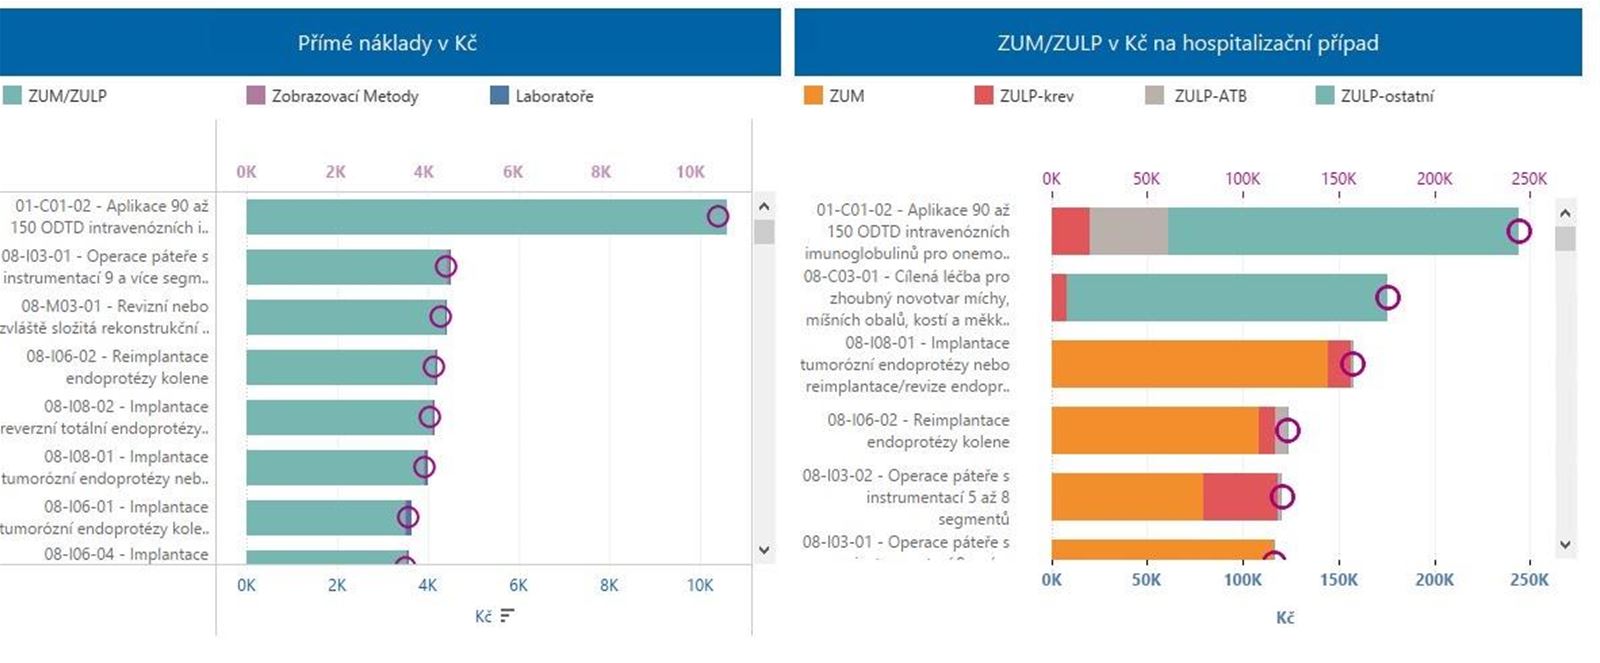
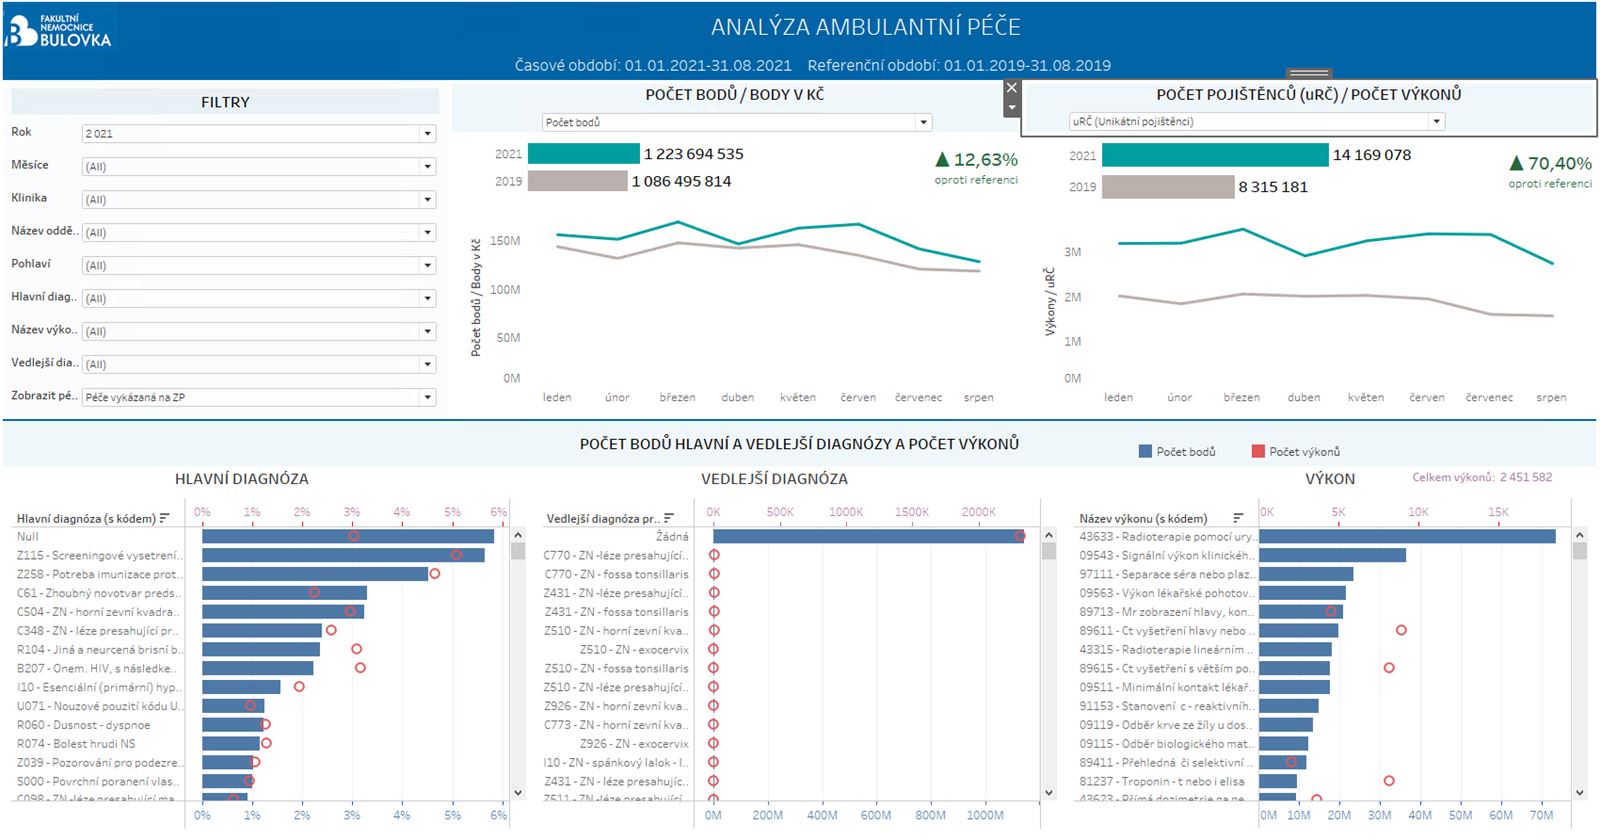
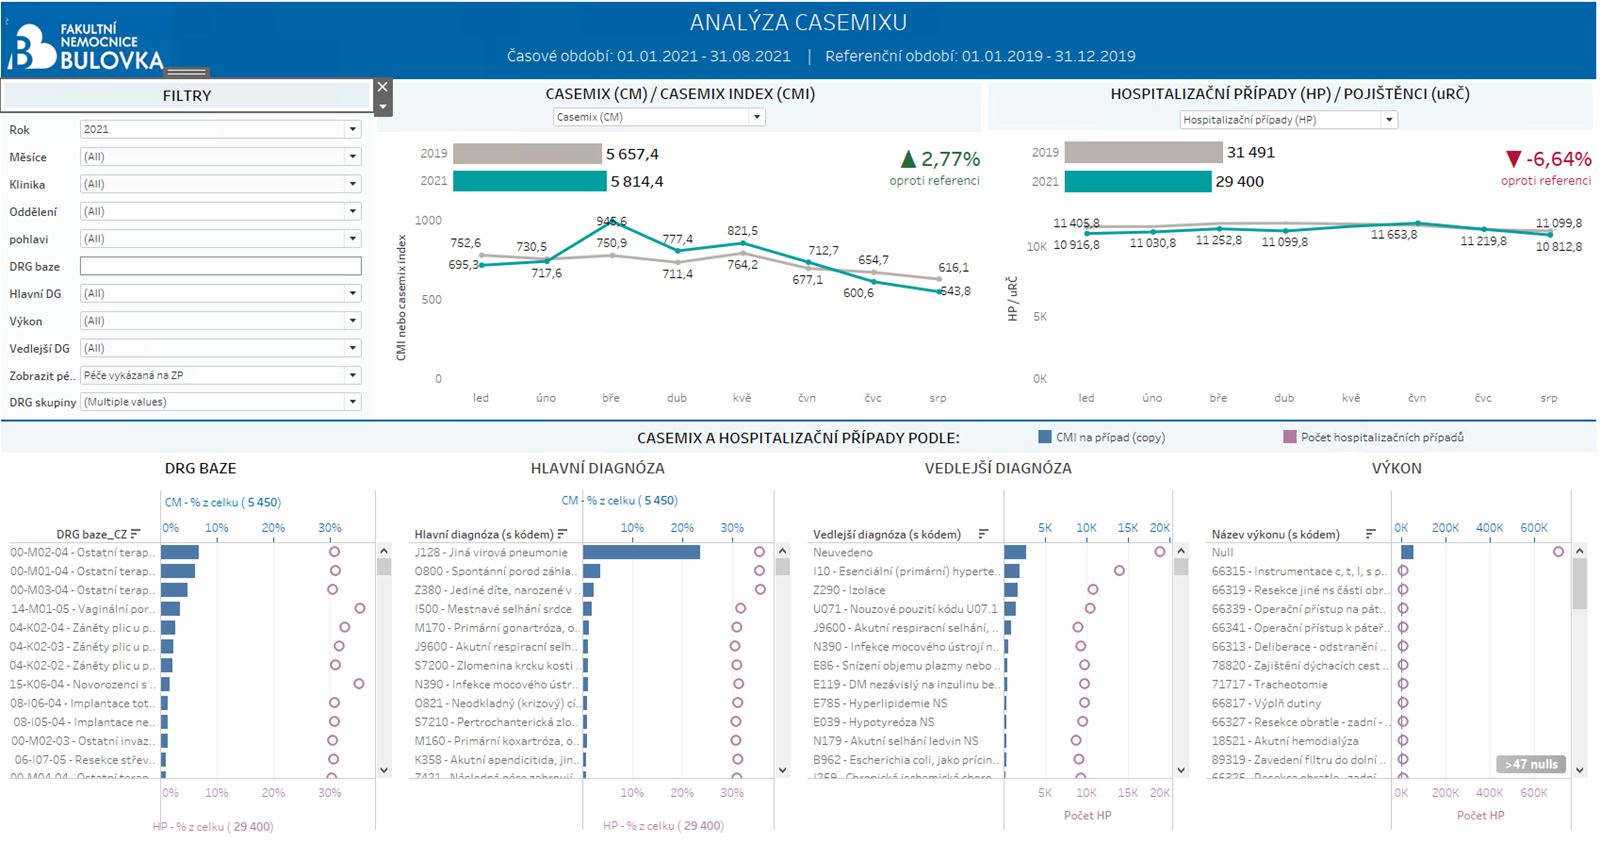
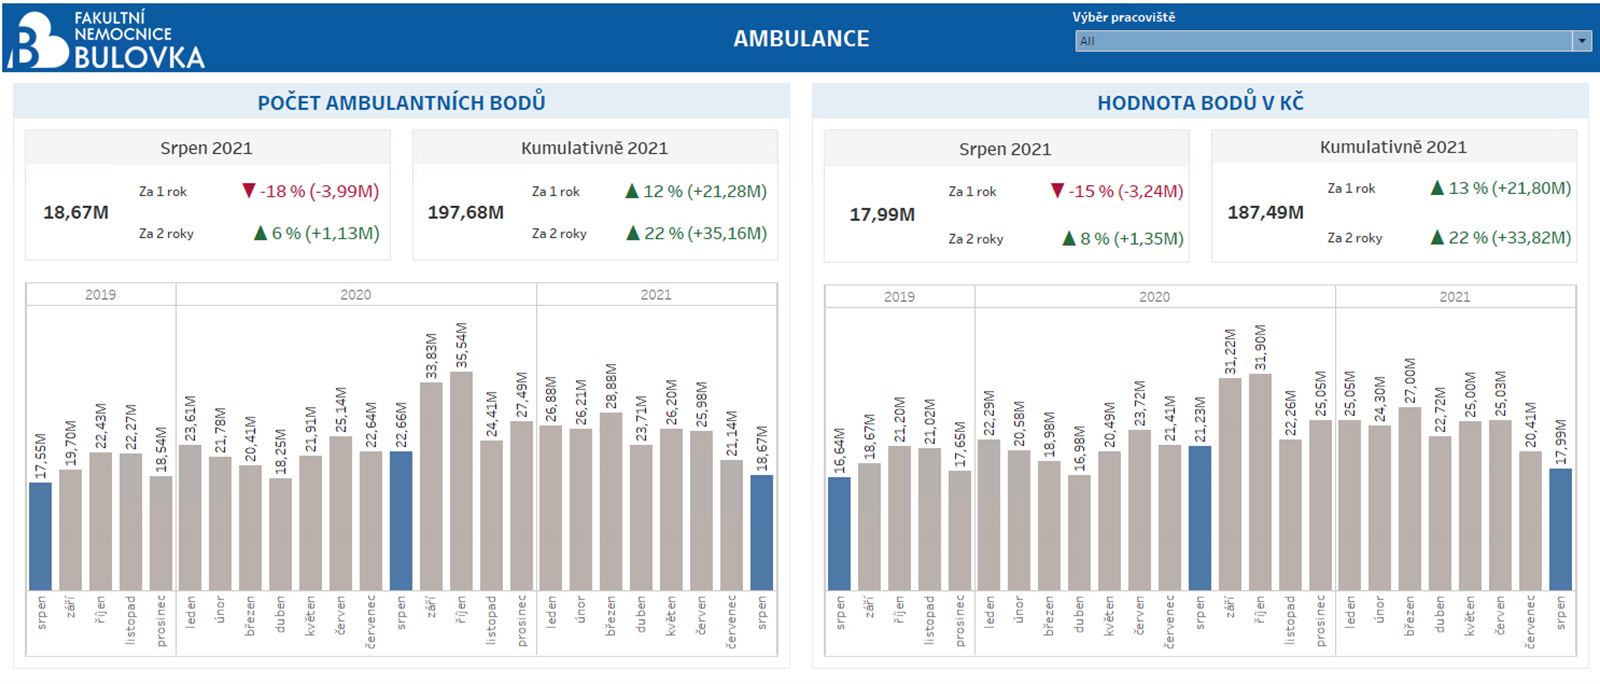
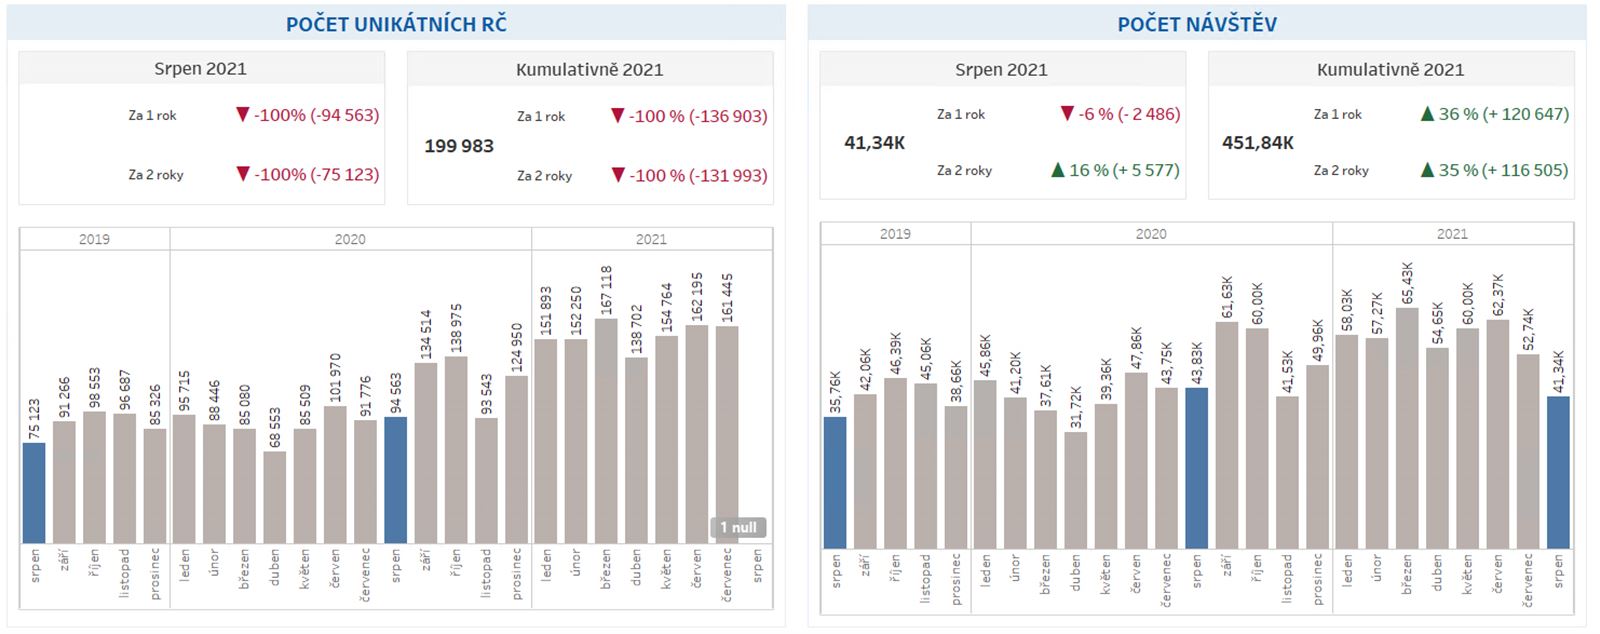
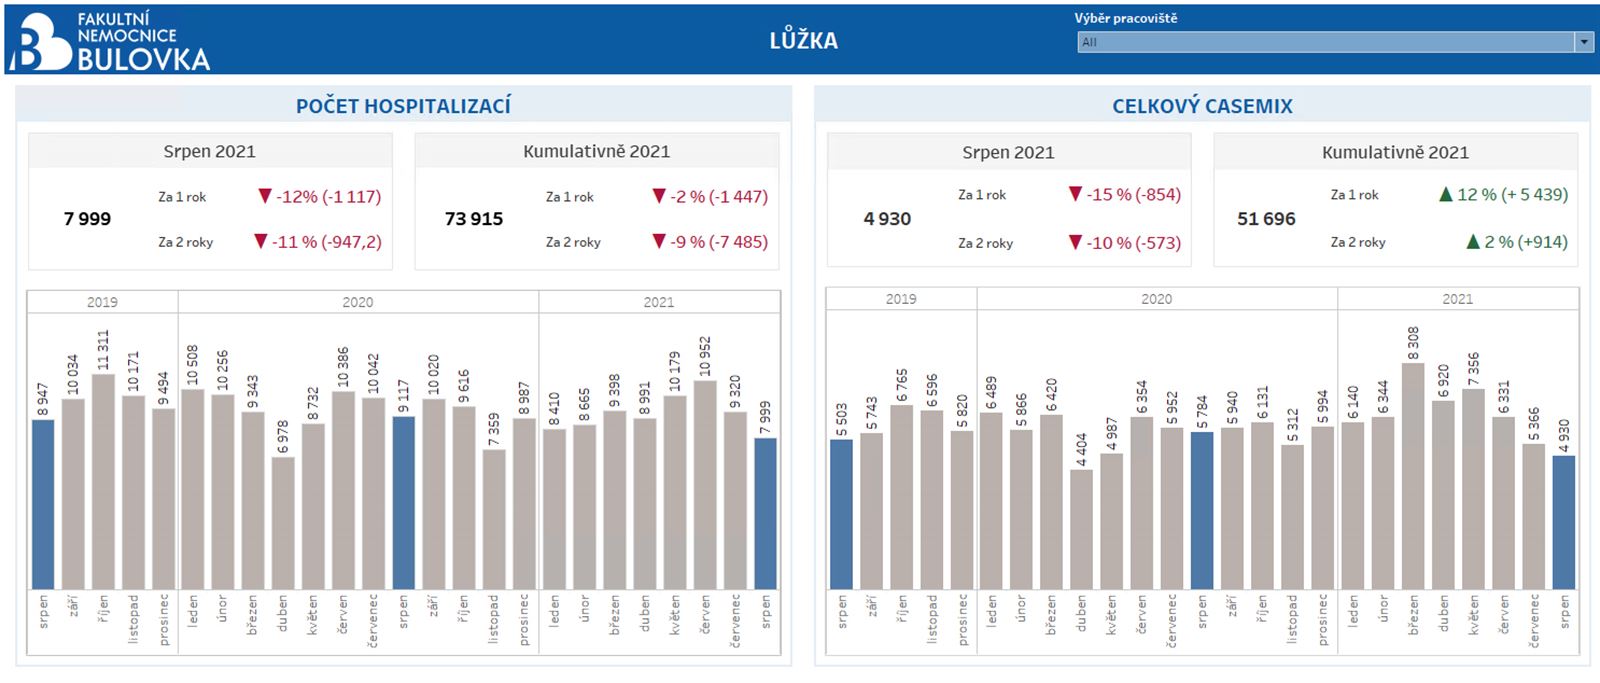
The parameters were a number of patients, a number of admissions, a casemix and a number of points for the ambulances. The dimensions by which the metrics break down include principal and secondary diagnosis, number of surgeries, or DRG groups.

The visualization that comes as a result, is easy to understand so that the doctors are interested in using it and intuitively accessing the necessary details and metrics with additional clicks.

The first clinical site where the new care reports are available for data management purposes is the Department of Radiation Oncology.

The result was evaluated by the deputy chief and head physician of the hospital department, for whom we prepared 4 dashboards with reports: inpatient care analysis, casemix analysis for inpatient care, casemix analysis for outpatient care, and outpatient care analysis.

"I appreciate the easily accessible and clear visualizations. Information about inpatient and outpatient care is now easily accessible to everyone who needs to have an overview and makes the doctors' work easier." says MUDr. Petra Holečková, Ph.D., MBA deputy chief physician and head of the inpatient department of the Institute of Radiation Oncology

Inpatient Care Dashboard

It displays an overview of acute inpatient care at a selected clinical site over a specified time period. It offers the possibility to narrow the selection to specific DRGs (diagnosis-related groups), main diagnoses and patient gender. The doctor can focus on complicated cases divided into four severity levels, find out the share of the clinic in the total casemix of discharges, and the share of the clinic in the casemix of the whole hospital.

Dashboard also offers the possibility to compare the hospitalization time with a reference average hospitalization time with a breakdown into DRG, major diagnosis or MDC (major diagnosis category). Similarly, it is possible to track the material costs of ZUM (separately billed materials) and ZULP (separately billed medicines) with a breakdown into blood, antibiotics and other. Direct costs then show the cost of imaging and laboratory tests in addition to ZUM and ZULP.

Dashboard analysis of outpatient care

The first graph shows the trend in scores by month compared to the reference (previous) year. Points can also be expressed in crowns. It also shows the evolution of the number of insured people (unique birth numbers) who were treated at a given clinic or the number of procedures. In addition to time, the dashboard can also use filters for gender, main and secondary diagnosis and name of the procedure, as well as it can display both the care reported to the health insurance department and care reported and retained by the health insurance department or reported, retained, and before reporting. In the lower half of the dashboard, there are summaries of principal diagnoses, secondary diagnoses, and procedures performed.

Dashboard analysis of casemix

Hospitals track casemix and casemix index - the former is the sum of the relative weights of inpatient cases for a given unit and period, the latter represents the average complexity of all cases treated (it is the average of all relative weights). It is usually advantageous for a hospital to maximize the value of the casemix and casemix index because patients with complications tend to have higher reimbursements, than patients without complications. The Dashboard tracks the number of hospitalizations, the number of unique birth numbers. In addition to the indicators mentioned above. It is also possible to track the breakdown into DRG bases, principal diagnoses, secondary diagnoses and procedures.

Dashboard for hospital management

Dashboard for hospital management clearly displays the production in outpatient clinics, where it tracks the number of outpatient points, the value of a point in Czech crowns, the number of unique birth numbers and the total number of visits per month. It also displays the production in inpatient care, where it shows the number of hospitalizations, the total casemix, the number of surgeries and the number of childbirths. The financial indicators, provide management with the ability to see total costs and revenues. The cost dashboard also displays costs broken down into personal costs, center drugs and non-center drugs. It is possible to monitor the performance of the hospital as a whole, as well as to select individual clinics or departments. It is also useful to see comparisons against a benchmark - the last year and the year before.

Dashboard for nurses

In order to allow the station and head nurses to easily monitor their current consumption and limit for consumable medical supplies (CMS), material and technical support (MTZ), medicines, center medicines and toners - a dashboard for nurses was created. It clearly displays the current usage and limit, as well as when the usage limit will be reset, how many pending requests are in the system, and the cumulative usage within the reporting period. This makes it easy for nurses to make sure that they are not exceeding their planned costs and to better manage their stock levels.

Overdue invoices

As part of the successful management of the hospital, it is necessary to monitor whether all receivables are paid on time and whether there is a negative trade deficit. With the help of this dashboard, it is possible to monitor the overdue invoices on individual accounts, filtered by customer, by center and by invoice series. It is also important to filter out the date of issue, in order to see on which date the receivables were paid or to compare them with a reference period. The dashboard shows the total nominal value of outstanding invoices as of a certain date. This value can be broken down into individual time intervals and compared to a reference period.

The effectiveness of using dashboards for hospital management

  • Thanks to visualizations, the Bulovka University Hospital can make easier decisions and a better plan, for example, the operation of outpatient clinics and the dates of planned surgeries.
  • Consultations with an expert team of data analysts outside the hospital provided an expert outlook on the issue of linking IT with the business insight, which is beyond the staff and time capacity when it comes to large-scale changes within the organization.
  • The added value here is the work with a comprehensive visualization tool that makes it easy to understand the hospital data and what that data means.
  • The benefit to the hospital also lies within the organization, where the internal changes create new steps. Doctors can see the practicality of these new steps by using data to plan their work more efficiently. The patients can see the change as well.
  • Bulovka University Hospital is transforming itself into a data-driven organization and is setting the direction in the industry for those who are planning to start or improve their data transformation.
Supporting Ukraine

Supporting
Ukraine